View Your Results
When a Run reaches Complete, its result layers are published to your project map automatically. This page shows you where to find them and how to read them at a glance.
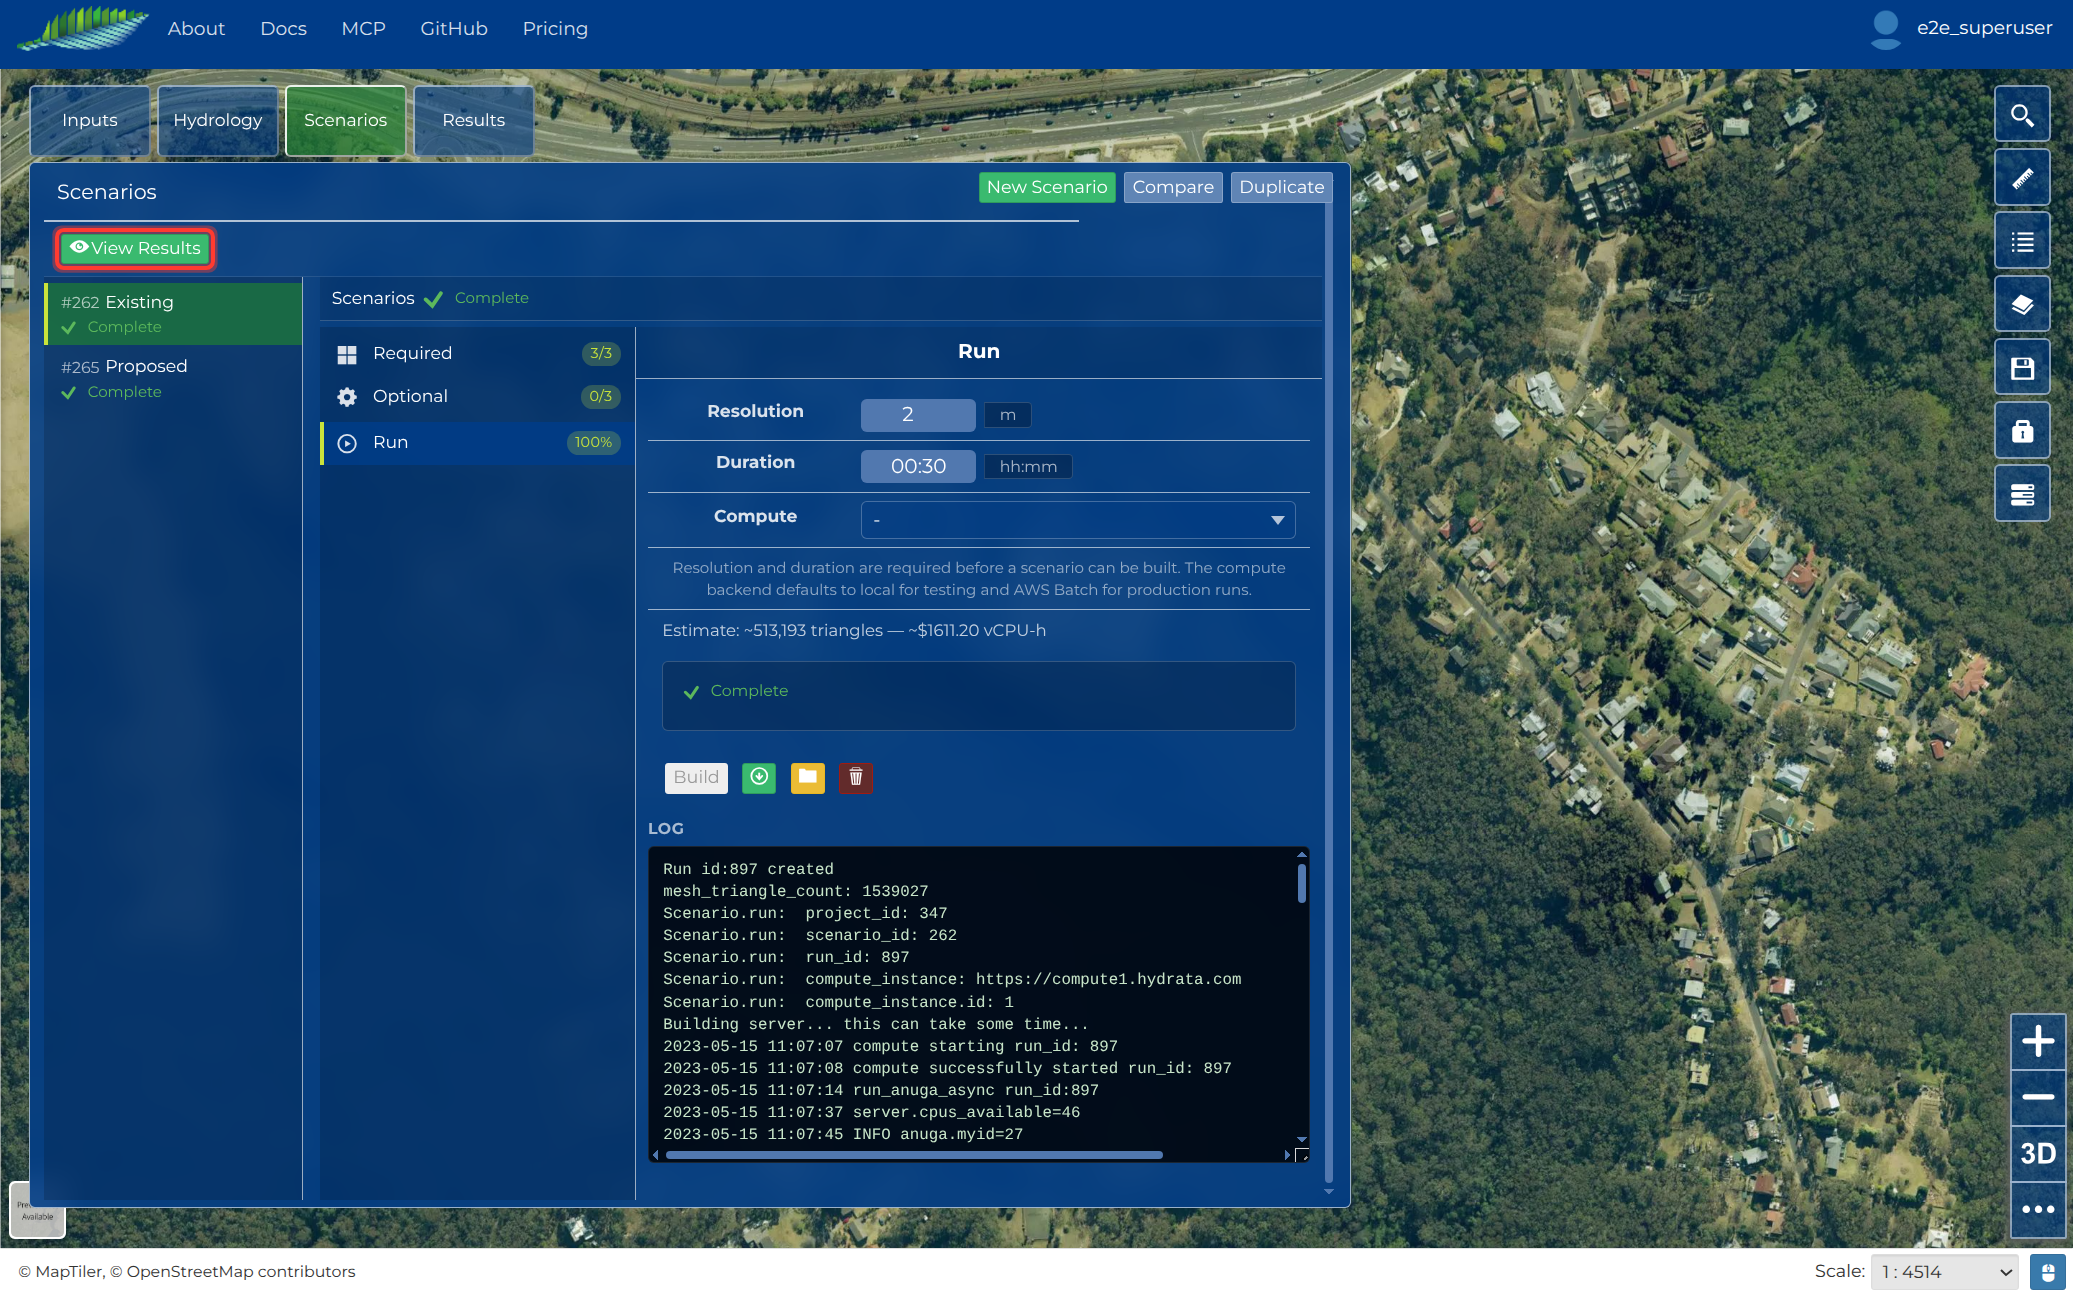
Open the results
The quickest route is the View Results button that appears at the top of the Scenarios panel when a Run completes. Clicking it closes the panel, opens the Results menu, and switches on the result layers for that Scenario.
You can also click Results in the left toolbar at any time.
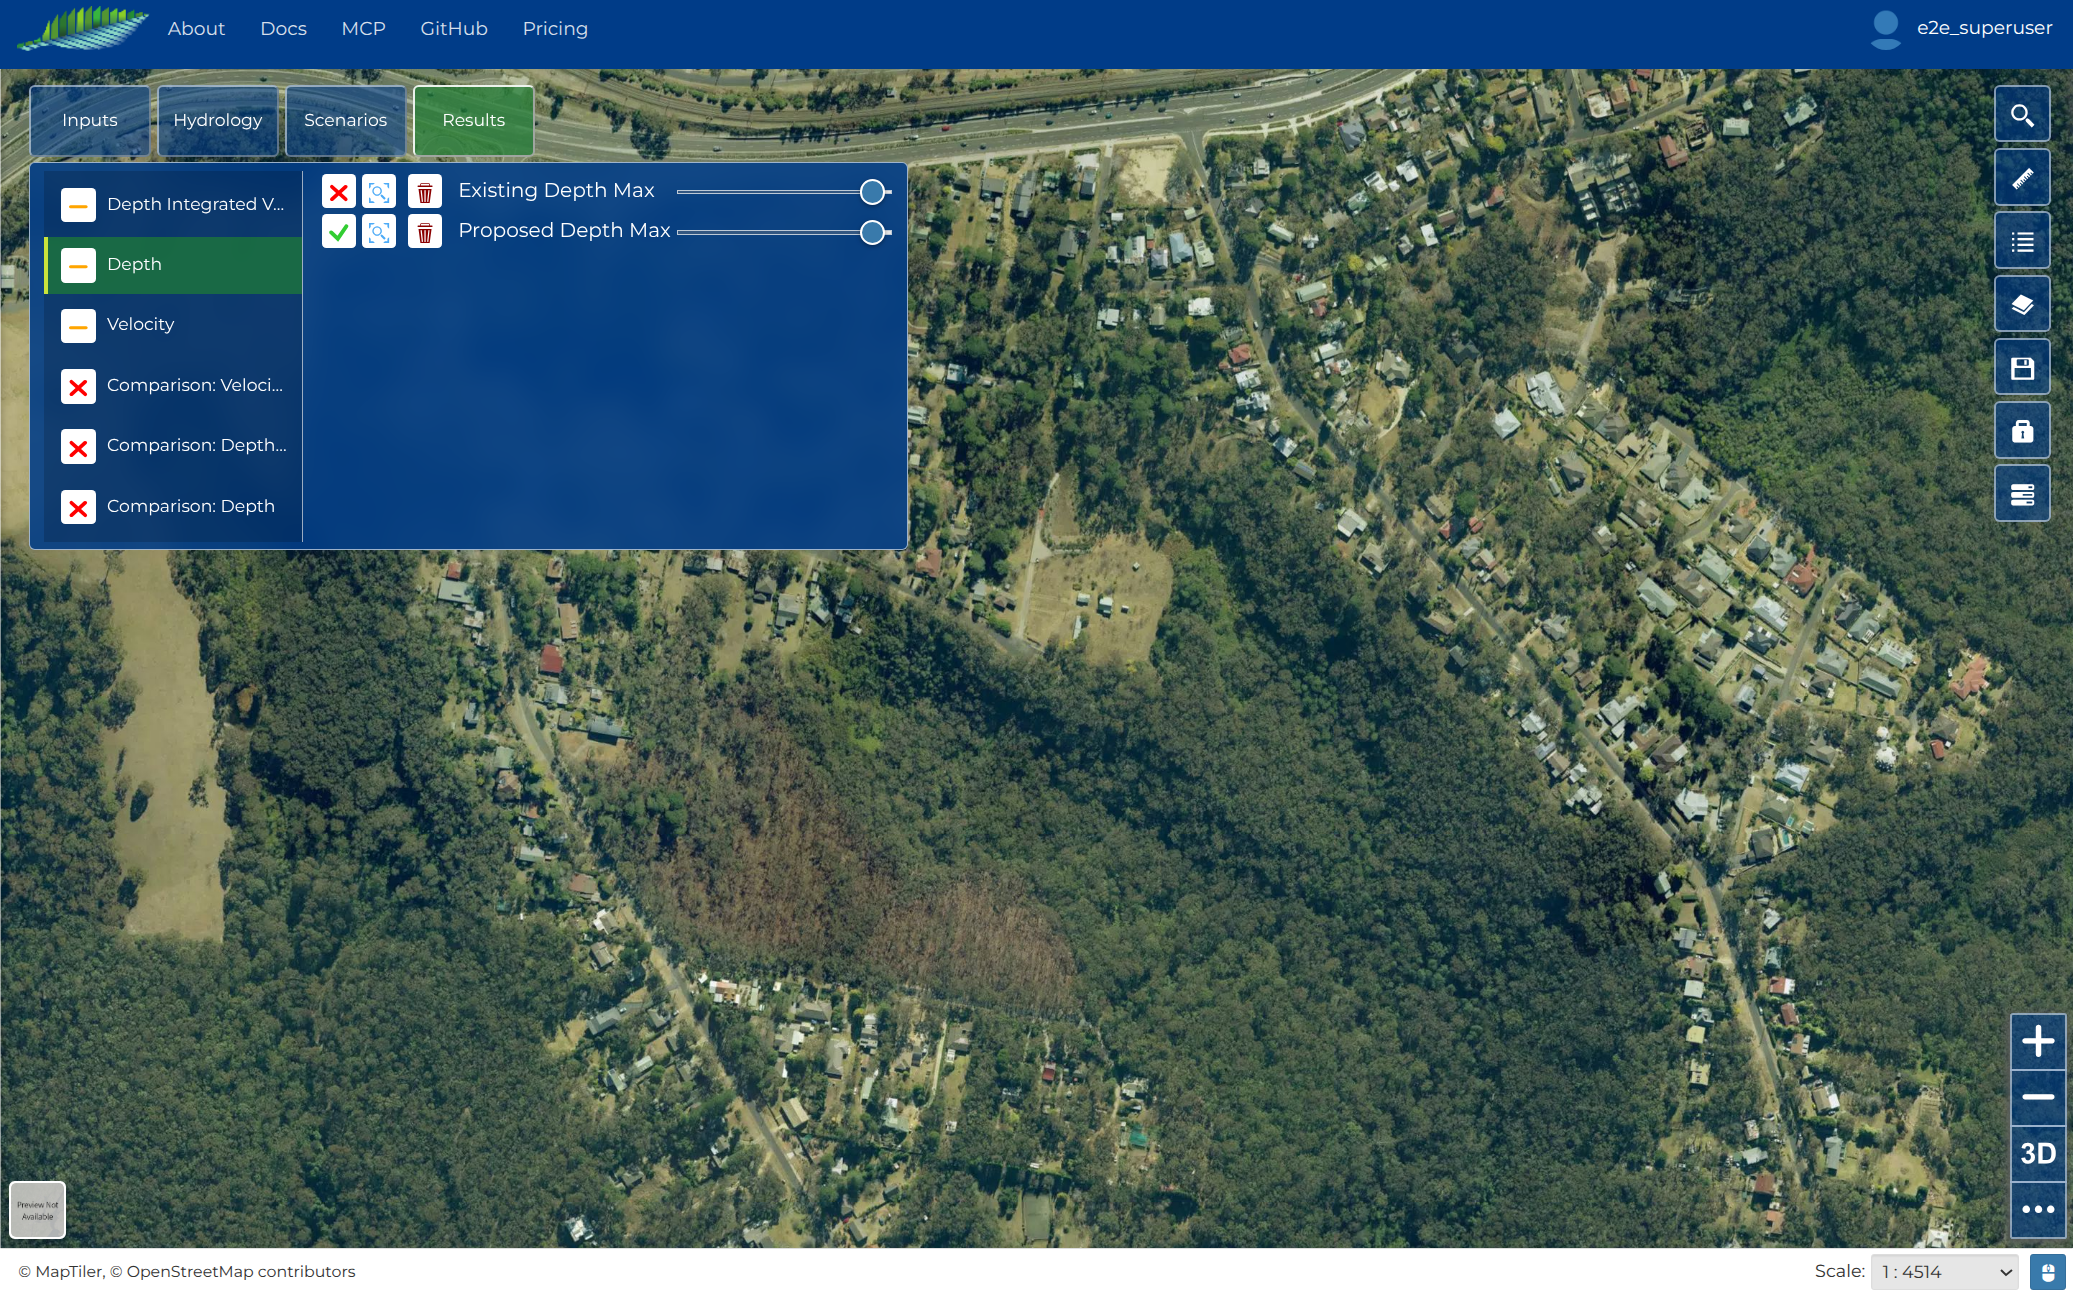
The result layers
Each completed Run publishes three raster layers, grouped by quantity in the Results menu:
| Layer | Shows | Units |
|---|---|---|
| Depth | Maximum water depth reached at each point | m |
| Velocity | Maximum flow speed at each point | m/s |
| Momentum | Maximum depth-integrated velocity (depth multiplied by velocity), a common flood-hazard indicator | m²/s |
Toggle each layer on or off with its visibility checkbox, and use the transparency slider to see the terrain underneath. Once you have several Scenarios, every Run's layers appear under the same three groups, so you can flick between them for a quick visual comparison.
Note
The maximum stage (water surface elevation) raster is included in the downloadable outputs but is not published as a map layer. See the outputs table for the full list, and use the download button on a completed Scenario to take the GeoTIFFs into your own GIS software.
A first look
Turn on the Depth layer first:
- Depth highlights where water ponds: depressions, channels, and behind obstructions
- Velocity picks out the defined flow paths through the catchment
- Momentum combines the two, showing where the bulk of the water actually moves
Tip
A quick sanity check for any model: water should appear where you applied rainfall, follow the terrain downhill, and leave through the transmissive edge of your domain. Deep water piling up against the domain edge usually means a reflective boundary is blocking the outflow (revisit Define Boundaries).
Next steps
You have now completed the full loop: project, inputs, Scenario, Run, results.
- Viewing Results covers result styling and interpretation in more depth
- Create a second Scenario with different inputs (a proposed building, a bigger storm) and run it: see Selecting Inputs for ideas on comparing Scenarios